One type of data in GIS are spatial data, which can be obtained from several sources, among others:
1) Data Map Analog
Data Map analog (among others topographic maps, soil maps, etc.) that maps in printed form along with the results scannya. Analog map created by cartographic techniques, are likely to have such a spatial reference coordinates, scale, direction of the wind and so on. In stage SIG as the purpose of data sources, map the analog is converted to digital maps in a way converted to raster format through the process of digitizing vector format so it can show the actual coordinates on the earth’s surface.
2) Data Systems Remote Sensing
Remote Sensing Data (among other satellite images, aerial photographs, etc.), an important source of data for GIS because of its availability at regular intervals and covers a certain area. With the assortment of satellites in space to the specifications of each, we can obtain various types of satellite imagery for a variety of application purposes. This data is typically represented in raster format.
3) Data Field Measurement Results
Field measurement data generated by its own calculation technique, in general, these data are a source of data attributes eg administrative boundaries, boundaries of land ownership, parcel boundary, boundary forest concession and others.
4) Data GPS (Global Positioning System)
GPS technology provide an important breakthrough in providing data for GIS. The higher the accuracy of GPS measurements with the development of technology. This data is usually represented in a vector format.
Input data SIG
GIS data referred to in this section is the data obtained from the results of field measurements. Measurement data can be converted into a digital map. The data used is the coordinate data measurement results. Input data is done by entering the coordinates of the observation data and save it in excel format (.xls / .xlsx) then calls the data and make it a XY event layer after it is exported into shapefile.
Steps input field measurement data into ArcMap is:
1) Create an Excel file that contains point number, coordinates X, Y coordinates, and a description that contains an explanation point, then close and save the file in the .xls format.
2) The distance between the title and the first data should not be inserted with the space because it will affect the reading of the data in ArcGIS 10.1 software so that the data can not be displayed.
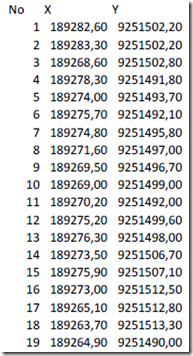
3) The following is an example spreadsheet containing the X and Y coordinates of the observation data.

Figure 8. Data coordinates X and Y coordinates in the form of a spreadsheet.
4) Open mapping software (Arc Map)

Figure 9. Software ArcGIS 10.1 (ArcMap)
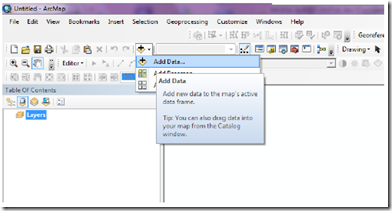
5) Put excel file that was created by clicking on the icon (Add Data) then navigate to the sheet where the data is located

Figure 10. Icon for adding data (Add data)
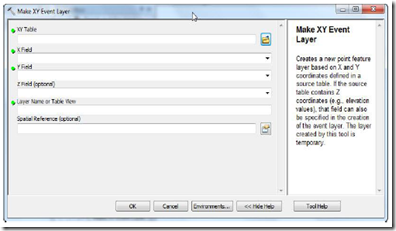
6) Once the file is successfully invoked the next step open Arc Toolbox> Data Management tools> Layer and Table View> Make XY event layer

Figure 12. Make XY event layer
7) Fill in the columns of X and Y column
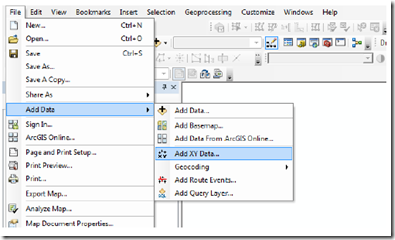
8) Input data from tables in ArcMap can be done by selecting the Icon Display XY Data. The results are the same with only the first step in this process Make XY event layer icon will appear automatically without having invoked through the Arc Tool Box.

Figure 13. Input data Add XY Data
9) After the data points have appeared on the display then the file is directly converted into the form shapefile by right-clicking on the name of the layer> Data> Export